ELISA Tips #1: Curve fitting best practices
Here are our expert tips to make sure your experiment is successful and your results are publication quality!
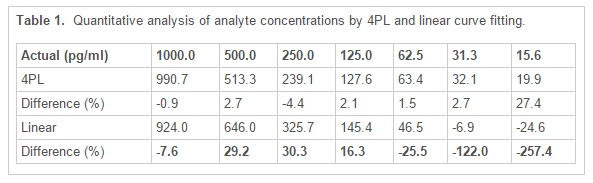
When fitting the data of your standard curve, it is essential that the method employed generates a trend line that is in close agreement with the standard curve. As a general rule, the r2 value of the trend line should be 0.99 or higher to ensure accurate results. A common mistake is to attempt to fit the data to a straight line. This often leads to significant errors in the calculation of unknowns, especially at the extremes of the concentration range. See the illustrations below for examples of good fitting and bad fitting standard curves.
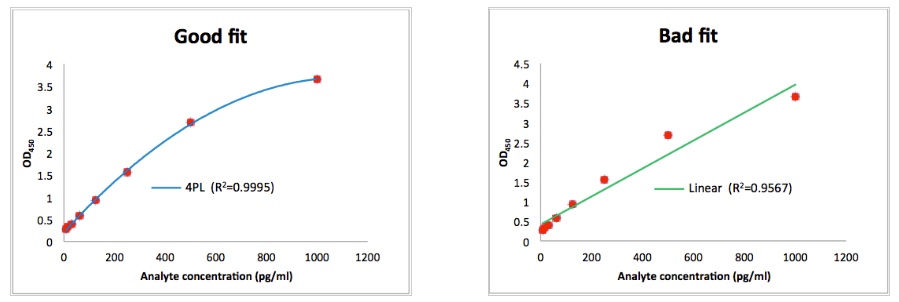
As not all standard curves are straight lines it is highly advisable to use a program capable of generating a four parameter logistic (4-PL) curve. If you don’t have access to 4PL software there is some good curve fitting software available online from websites such as ELISAAnalysis.com. This website is free to use and utilizes 4PL curve fitting as standard with many other curve types available if required.
The significant improvement in curve fitting is highlighted in the table below. Clearly the poor fit of the linear trend line (r2=0.9567) has lead to significant errors, especially at the mid and lower sections of the standard curve.
In contrast the 4PL trend line has generated analyte concentrations that are in good agreement with known values.
Alternatively, plot a best fit curve through the linear portion of the standard curve and overlay a linear trend-line. Usually this is achieved by removing one or more of the higher standard points, as high analyte concentrations can lead to assay saturation and a resultant plateauing of the standard curve. Once an r2 value of 0.99 is achieved the resultant equation displayed on the graph can then be used to calculate the unknown concentrations by solving for x.
Another alternative is to do linearising transformations. Essentially this involves the transformation (commonly log or ln) of either or both variables to generate a straight line on which a linear trend line can be used.
Regardless of which method you are using always ensure that the resultant trend line provides an r2 value of at least 0.99.
- High Quality – Our kits match or exceed the performance of leading suppliers.
- Economical – All kits priced at $350.00 (excluding shipping and GST).
- Australian Made – Why wait weeks for international shipping?
Please visit www.ELISAkit.com to see our rapidly expanding product list.